Campaign analytics
Basic analytics
Understanding the results of a push campaign is key to analyzing the performance of a message. The campaign list gives you basic information on all your push campaigns:
- Sent: The total amount of sent push notifications. This number is updated every few minutes.
- Open rate: The percentage of users who opened your notification directly or indirectly. Please note that the open rate of a campaign scheduled in local time may change over time since Batch can take more than 12 hours to deliver push notifications to all your users in different timezones (see more here).
Basic analytics are not available for campaigns sent from the API in dev mode.
Campaign analytics
Campaign analytics exports can be downloaded from the dashboard. The export is in the form of a CSV file containing campaigns metrics, settings, and much more. It allows you to filter your campaigns' metrics & data to include in your export. These exports are available from the Push tab.
For example, you can:
- Analyze push notifications campaigns performance
- Analyze A/B test campaigns
- Compare campaigns metrics by label, type, source, country, etc.
- Run in-depth analysis thanks to the extended data exported: sending time, targeting type, message content, etc.
- Analyze Trigger campaigns' user journey metrics
- Etc.
Set your export from the Campaigns list
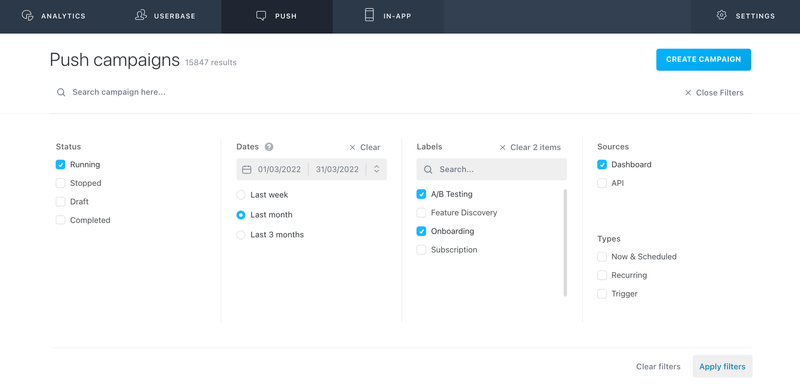
First, click on "Filter" and select the status, date range, labels, sources, and types of campaigns. Click on "Apply filters" button to save your choices.
Then, click on "Export" button on top of the last column.
Export filters
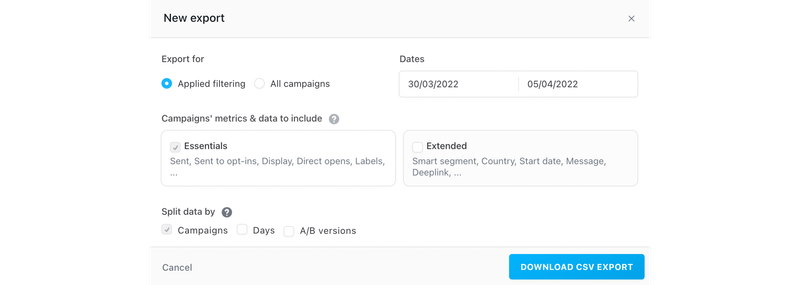
Before downloading the CSV Export, you can specify the granularity of your export. By default we are exporting the campaigns corresponding to the filters you selected. You also have the possibility to export directly the metrics for all your campaings by checking "All campaigns" button.
Campaign’s metrics & data
All exports automatically contain essential data by default:
- Essentials metrics represent all the metrics available in your CSV export by default, they are always included. Here is the list of the metrics: token; type; source; status; sent date (now/scheduled); label; campaign; sent; sent opt-ins; direct open; influenced open; reengaged users; errors; uninstalls; skipped; opt-outs-feedback.
In addition to the default export data, you can add additional data:
- Extended data allows you to enrich your CSV export with the following campaigns setup information: start date (recurring et trigger); end date (recurring and trigger); sent time (now/scheduled and recurring); utc/local (now/scheduled and recurring); smart segments; country; custom audience (YES/NO); languages; targeting applied (fullbase or custom targetting); message; rich media (YES/NO); deeplink; custom payload.
Split data
You can choose the level of granularity of your CSV export. The campaign granularty is always selected, you have the possibility to go further in the granularity of your CSV export by choosing to split the data by days and/or by variation by selecting the A/B versions.
Advanced analytics
If you want to see more detailed stats about a specific campaign, you can click the Stats icon in the campaign list. Let's dive into the details of the available statistics here:
Summary
You can find here global data on your campaign, since it has been created. The metrics displayed here can depend on the campaign's nature and status:
- Target: Total number of installations that meet your campaign's conditions.
- Sent: Total amount of push notifications accepted by Apple or Google, but not necessarily delivered to the end device.
- Bounced: Total number of notifications Apple or Google couldn't deliver because users didn't have the app anymore or because of other errors.
- Opened: Total number of users who clicked the notification (direct open) or opened the app in a 3 hours range after receiving the push (influenced open).
- Open Rate: Total of opened notifications (direct + influenced) / Total of notifications sent to users who accepted push notifications and are not in the imported segment.
Performance
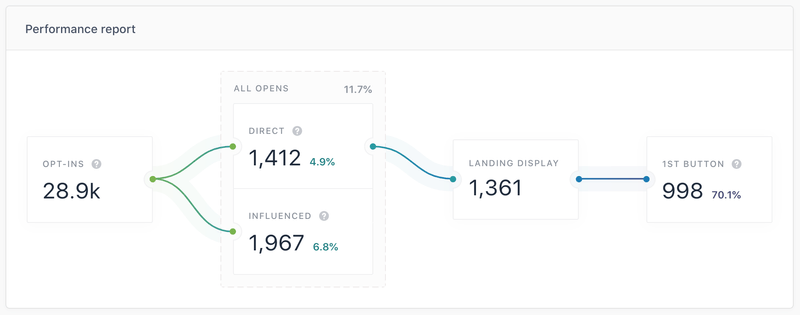
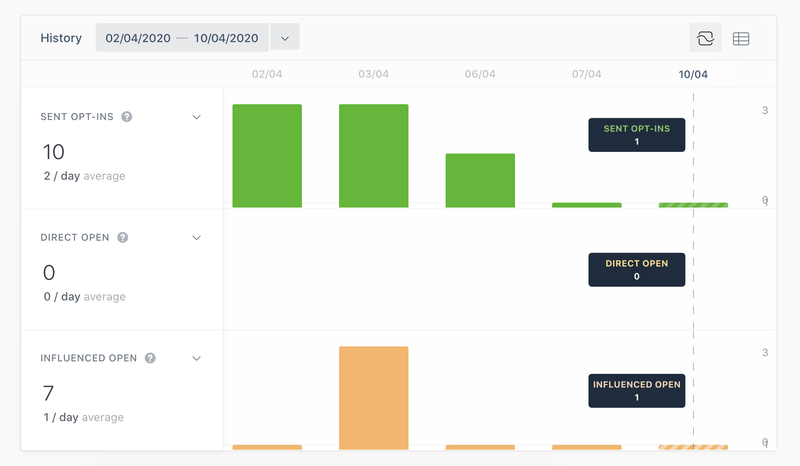
The Performance report is built like a conversion funnel. It allows you to measure your campaign's success at a glance:
- Opt-ins: Number of notifications sent to opt-in users.
- Direct: Number of users who clicked the notification.
- Influenced: Users who received the notification and did not click it, but opened the app in a 3 hours range afterwards.
- Reengaged: Dormant users who received a notification, opened it and then came back to the app/website in the 3 days following the notification reception.
If you attached a Mobile Landing to your push campaign, you will find additional stats:
- Landing display: Total number of users who displayed the Mobile Landing.
- 1st/2d button: Number of clicks on the first or the second button of your Mobile Landings. Hover over the tooltip to see the content.
Delivery
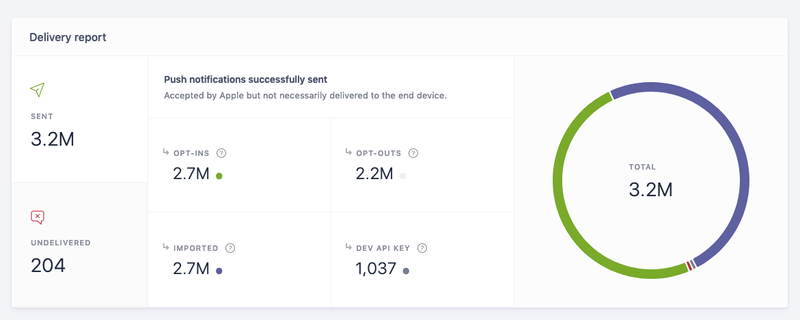
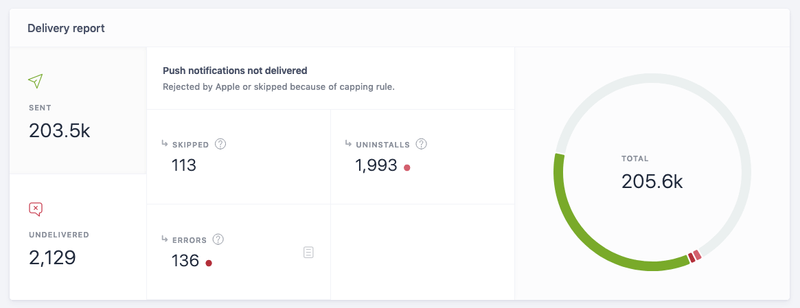
The Delivery report gives you detailed information on the status of all the device tokens targeted by your campaign:
Sent
- Opt-ins: Notifications sent to users who were opt-in to push notifications when the campaign targeted them.
- Opt-outs: Notifications sent to users who were not opt-in to push notifications when the campaign targeted them.
- Imported: Notifications sent to imported users (more information here)
- Dev API Key: Notifications sent for installations on the Dev Api Key. A high number of notifications sent on the Dev Api Key can mean that your production app version does not integrate the right Batch API Key.
Undelivered
- Skipped: Number of unserved notifications because the capping limit was reached for the targeted installation.
- Uninstalls: We tried to send the campaign to those devices but they no longer have the app installed.
- Errors: Errors sent by the push provider (FCM/APNS). Click the list icon to see the list of errors.
A/B testing
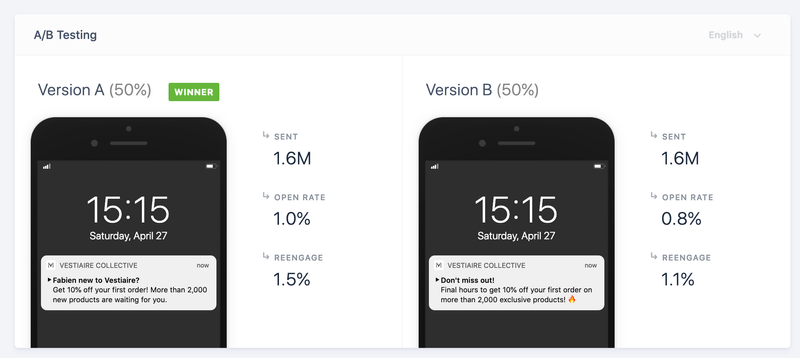
Batch also shows relevant information on your campaign if you are using the A/B testing feature. In the detailed results of your campaign, you will see how each message perform over time in a tabbed view.
If you want to track the number of marketing and transactional push notifications sent everyday from the dashboard or the Campaigns/Transactional API and see the global open-rate of your campaigns, take a look at Notifications, in the Analytics tab.
User Journey
If you created a user journey, Batch will display an additional report in your campaign analytics. You will be able to see how many users are still waiting for the timer to finish and why they exited the user journey:
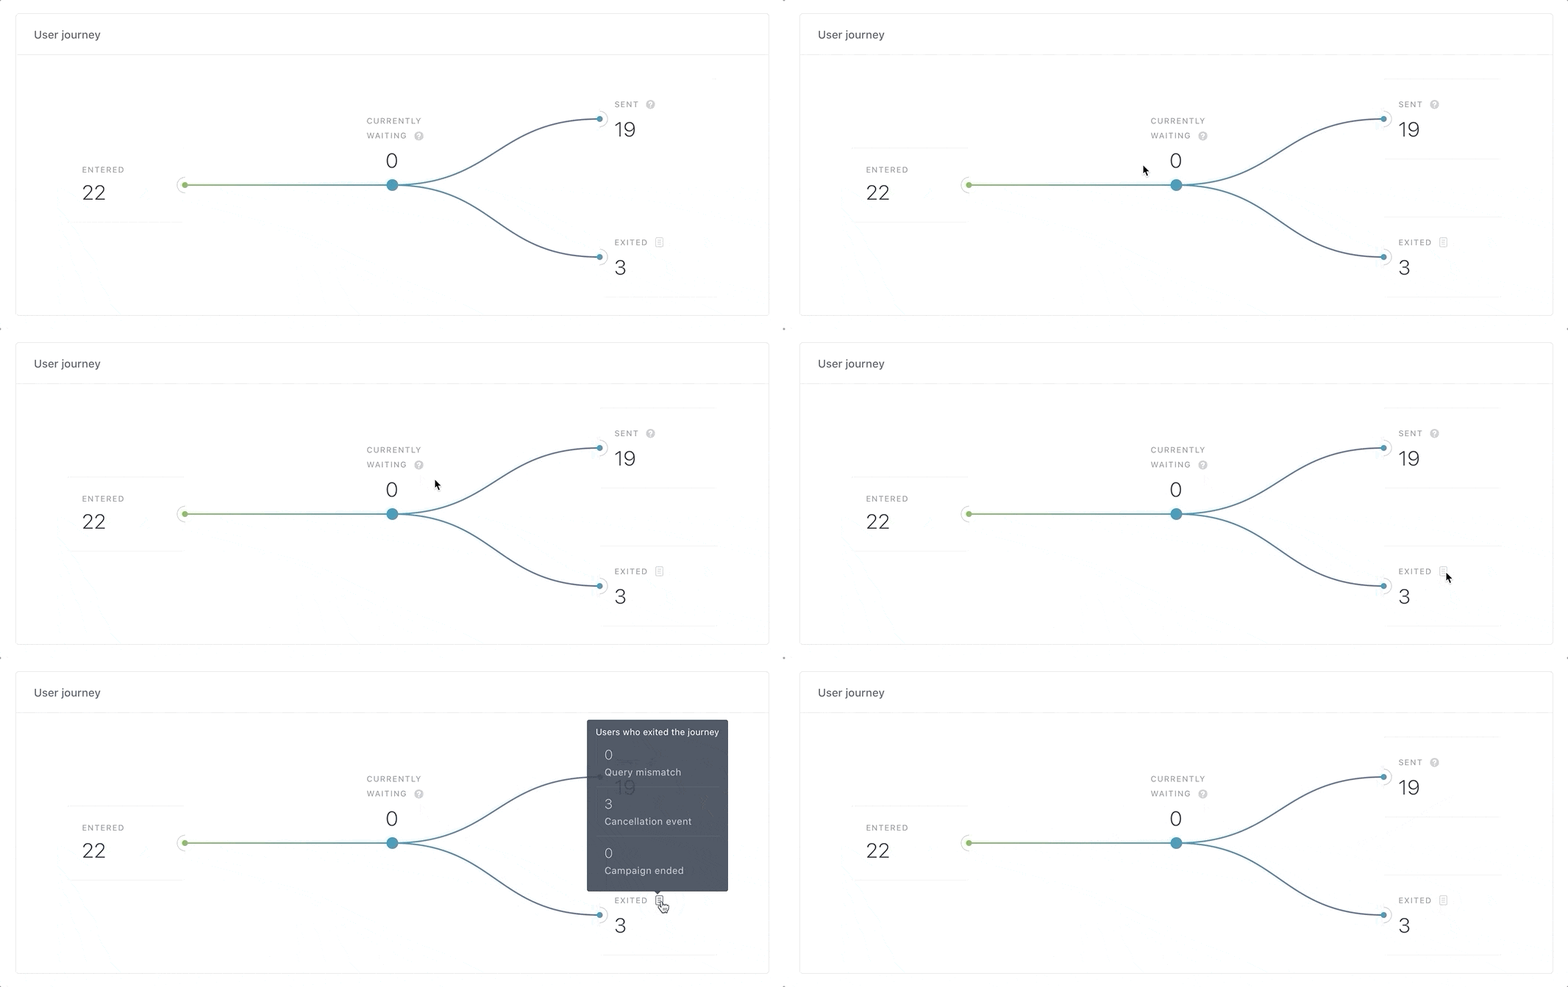
You will also see the number of push notifications sent every day from your trigger campaign:
